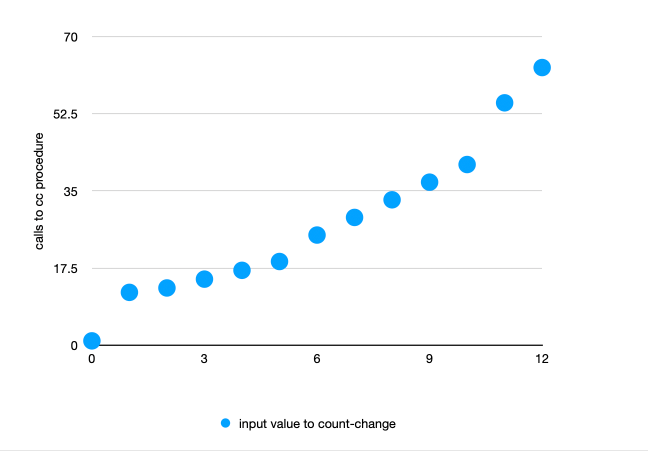
This table and chart reflect the number of computational steps (reflected in calls to cc) that result when invoking count-change with a given input
| input value to count-change | calls to cc |
|---|---|
| 0 | 1 |
| 1 | 12 |
| 2 | 13 |
| 3 | 15 |
| 4 | 17 |
| 5 | 19 |
| 6 | 25 |
| 7 | 29 |
| 8 | 33 |
| 9 | 37 |
| 10 | 41 |
| 11 | 55 |
| 12 | 63 |
looks pretty linear to me though with occasionally jumps. I’m not sure if the jumps matter for Order of Growth analysis