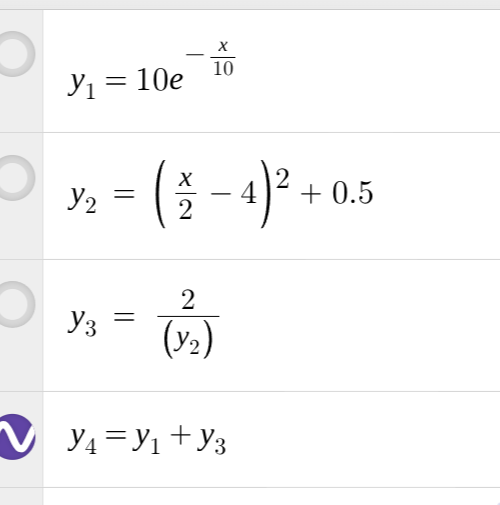
Another thing I realized looking at the trend lines I drew: I often see functions/graphs as multiple summed functions.
eg, here is a similar shape as the infant mortality graph (not to scale)
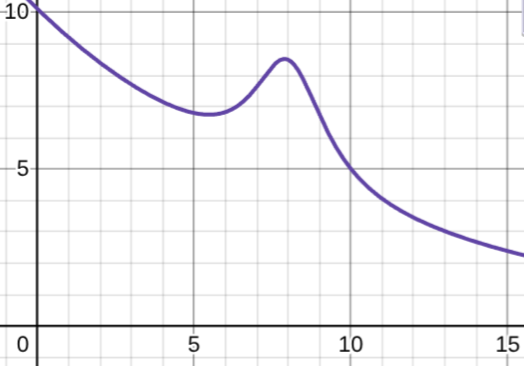
I wonder if this has an effect on how I interpret data? Do any of you automatically break down graphs and shapes like this? Do artists with no math background do the same kind of thing? Is it common for this intuition to be taught in high school alongside calculus? If everyone could do this and did it, would any public debates change in any substantial way?