It’s very sad/hear about the conditions people are facing. I hope more efforts are made to help get civilian/non-combatants out of the conflict zones, even if they can’t get out of Ukraine. It doesn’t appear that the Russian military has the intention of inflicting mass death or genocide (i.e. killing millions of people) at this point. Or maybe they have that intention but have not fully acted it out yet. I have seen multiple hypothesis on what their objectives are in the war but some have suggested they may do to Kyiv what was done to Grozny in the Chechen War. That would be unbelievably horrific.
You’re trying to analyze whether racism is present. I think you need to step back and consider what methods you’re using to do that, why you think they’re correct, what actions you’ve taken in the past to learn good methods for racism detection and whether those actions were adequate, etc.
It seems like we got practice at cancel culture and deplatforming, and lots of tech companies doing it to the same target at the same time. And now that’s being turned on Russia. I think it’s interesting that something awful is 1. being used for a different cause, as its critics said it would be 2. arguably being used for a good cause this time (it’s hurting Putin and his war, which is a good cause. but it’s also hurting Russian people, many of whom do not want the war. when Twitch or OnlyFans cuts off all Russians, I figure most of the individuals being directly harmed are opposed to the war. apparently Apple, Microsoft, Visa, Mastercard and others are getting in on the boycott. they are good at bandwagoning and mobbing a target. this is very dangerous. imagine this power used for some other cause. but there’s an upside this time, as opposed to with domestic cancel culture where there’s little upside.)


I watched the introduction part (5.5min).
There are some good parts in this article about the Ukraine war, but it also reminded me of a book: How to Lie with Statistics Reissue, Huff, Darrell, Geis, Irving - Amazon.com (If you read the article and don’t catch the dishonesty in an automatized way, that’s a way you, like most people, are vulnerable to being influenced by propaganda.)
top comment:
sad fact is that tiktok has done a better job of bringing unbiased information about the happenings in the Ukraine than any news site has


The article showed a graph showing the value of bitcoin compared to the ruble, and a graph showing the value of bitcoin compared to gold. I couldn’t see any problems with the graphs when I first saw them, but I was on high alert cuz Elliot said there was dishonesty. I was really suspicious of someone trying to compare things to bitcoin, so I spent a while on that part.
The article after showing the bitcoin-ruble graph, prefaced the bitcoin-gold graph with: “And this is not just against the ruble. Bitcoin (BTC) is doing fine against gold.”
The bitcoin-ruble graph was linear, and it was pretty clear that it was linear. you could see on the left of the bitcoin ruble graph that each line was in a nice 0.5 million ruble increment.
I assumed the bitcoin-gold graph was also linear. and it looked really nice and smooth and like it held its value really well.
I spent a few minutes trying to look at the graphs cuz I was suspicious of them, I ended up actually trying to read what the value of each line was on the bitcoin-gold graph (the value marks were not readable without clicking on the image, but the value marks on the bitcoin-ruble graph were readable without clicking on the image), so I clicked on the image and realized the values were logarithmic, not linear. Each line was 100 times the value of the last one, and it doesn’t even show the value of the very top line, you just have to know that each lines value increases by 100, and the last marked line was a value of 1, so the line that is above the 1 line HAS to be 100.
In the header of the bitcoin-gold graph it mentioned it was logarithmic, I’m pretty sure I even read that it was logarithmic before I tried to analyze what the values were, but I didn’t realize it was logarithmic until I saw the value lines. The graph has a white background and the header has 2 lines. On the first line of the header it says “Bitcoin to Gold Ratio” and it’s a large, black font. On the second line it says “How many ounces of gold does it take to buy one Bitcoin? Logarithmic Scale” it a smaller, gray font that blends in with the background more easily.
In the bitcoin-gold graph you can read both the headers without clicking on the image.
Also: the bitcoin-gold graph goes from 2011 to 2022, but the bitcoin-ruble graph is only from about november 2021 to march 2022
Another weird thing: each year at the bottom of the graph is separated by about 130 pixels. On the value line of the bitcoin graph, it also has markers showing when 2011, 2013, and 2017 were. the 2017 marker on the value line is about 6 pixels to the left of the 2018 marker on the bottom of the graph.
In the article, below the text that says “But this success hides a generational conflict.”, it shows a graph. The graph shows what seems to be a poll. The header says “Russians Against the War”, it then has age groups and the percentage of each age group that is against the war, the percentage goes from 0% (0% is unlabeled, it’s just implied that it’s 0%. idk why it’s not labeled) to 70%. The 18-29 age group is 40% against the war, but the graph only goes up to 70%, so if you just look at the graph it would look like over half of the 18-29 age group is against the war, even tho it’s 40%.
Yeah. The issue that stood out most to me was the graphs that start above zero. E.g. the ruble’s value fell by like half, but the graph made it look more like it fell by three quarters.
I don’t see a big problem with this graph↓
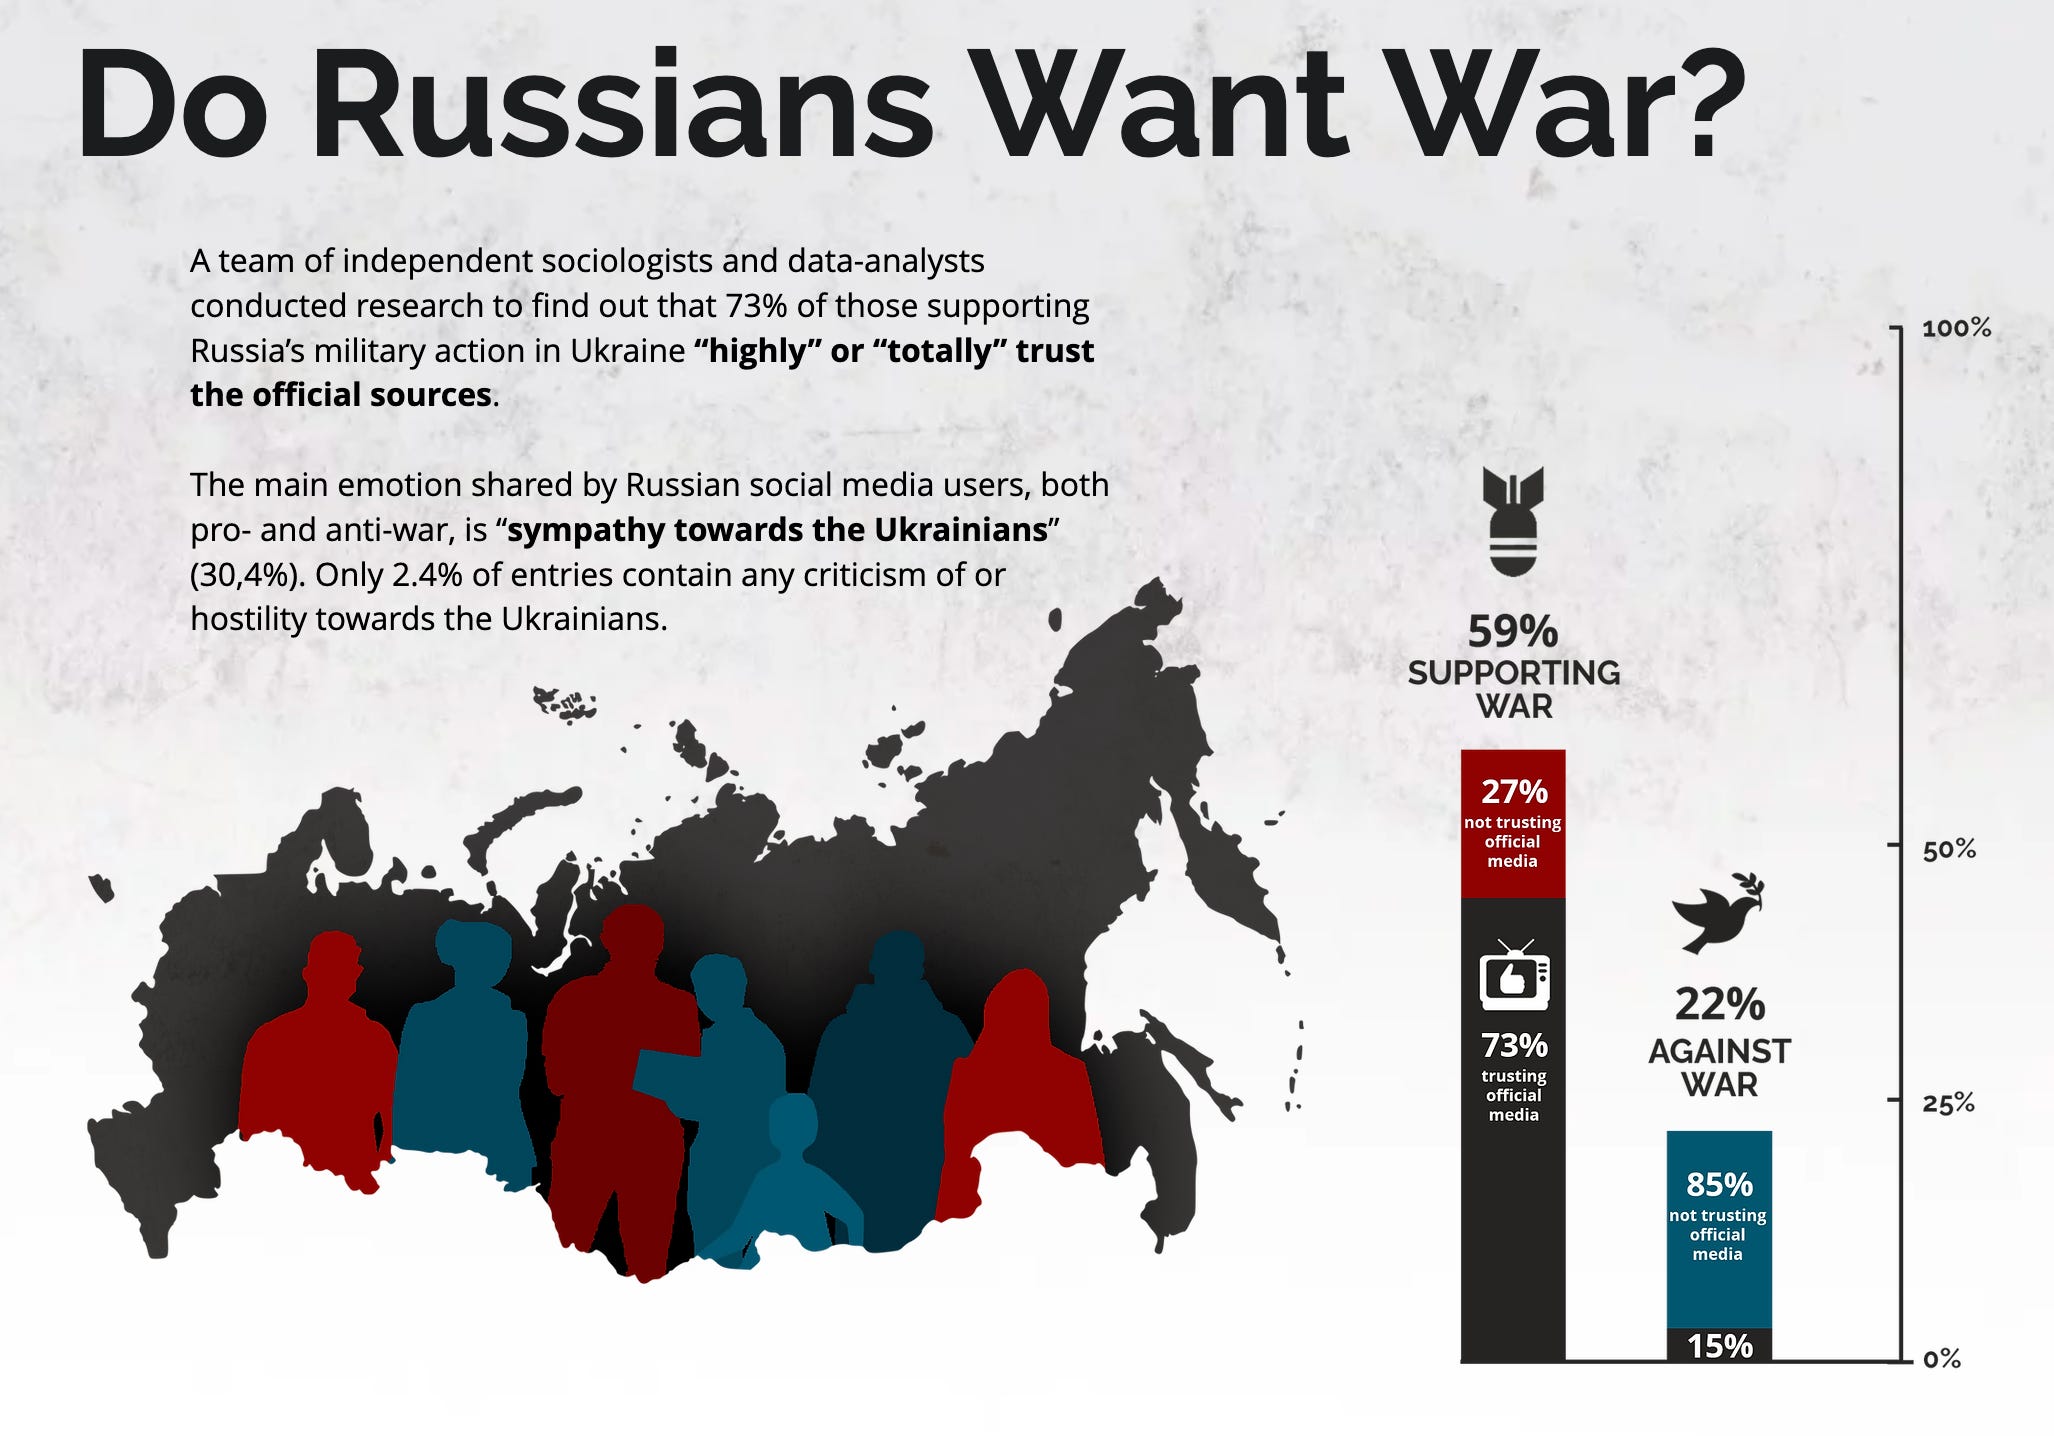
It doesn’t add up to 100% with the supporting war and against war groups. I assume the third group would be something like: I don’t know whether I support war / refuse to answer, but it’s not actually displayed. I don’t think this matters much, but it would be better if they showed the third group.
It goes from 0% to 100%. It marks 0%, 25%, 50%, then 100%, IDK why they skipped 75% but I don’t think it matters much.
Inside each group, it shows what percent of that group trust’s the media, and what percent does not trust the media. I think that’s fine.

This video includes some clips of Putin/Russia-friendly right wing news commentary.
[Monica Crowley, a Fox News host said:] Look, Russia is now being canceled, right? I mean, between the fierce Ukrainian resistance and the widespread international financial sanctions and boycotts and Russian teams being barred from international competitions. Russia is being canceled.
I edited the emphasis to highlight the idea that Ukrainian military defense counts as part of cancelling Russia.
You might want to stop reading after the title.
https://twitter.com/AnnCoulter/status/871210560100216833
In 20 years, Russia will be the only country that is recognizably European.
And a screenshot to archive it:

Some leftwing perspective on the mainstream media being awful.