Notes on 10.3 Discrete Probability Distributions:
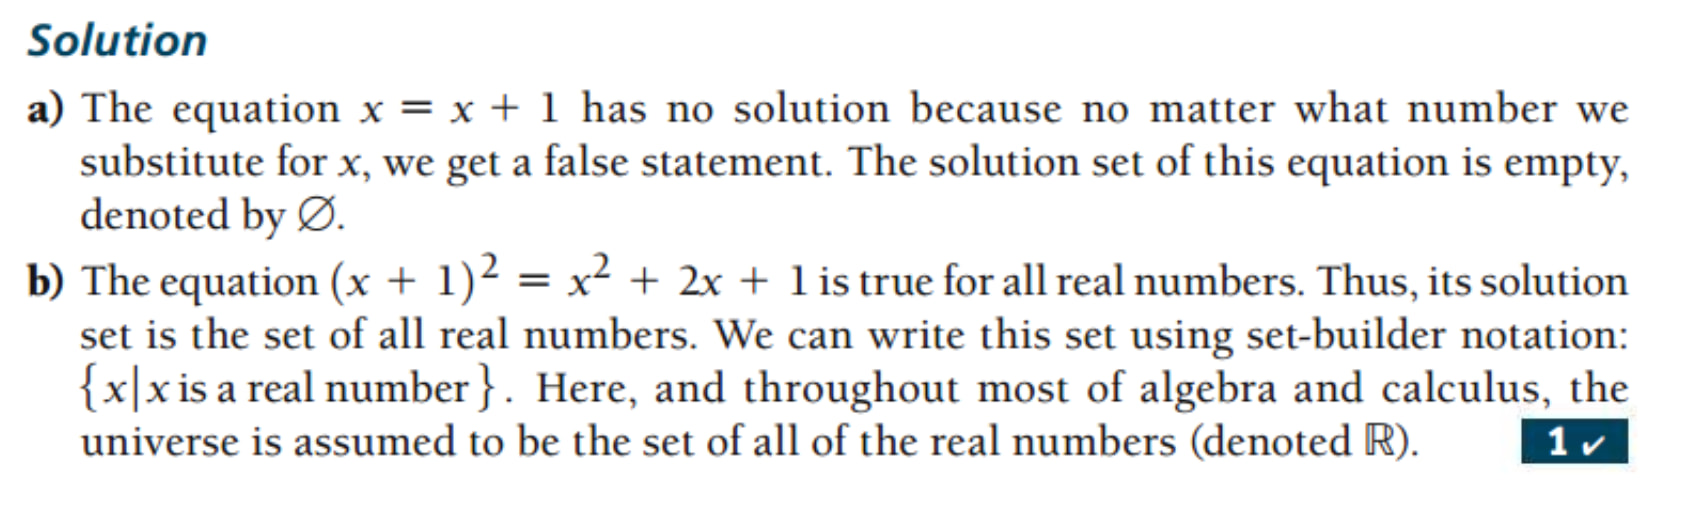
they form a probability distribution, which
can be represented by graphing the probability of an outcome as a function of that
outcome.
turn the probability of an outcome into a function of that outcome and then graph it
Such a graph is a bar chart called a histogram.
This makes it sound like the only graph of the probability of an outcome is a bar chart/histogram. Ok.
So random variable in this context refers to a specific function. Ok. X(s) = x, where X(s) is representing some element in the sample space, s being some element in the sample space, and x being the value giving to some element s.
A random variable is a measurement used in an experiment with random outcomes
that allows us to read (or “measure”) the outcomes of the experiment. For convenience,
the notation for a random variable is often shortened to X, instead of X(s). The set of
outputs is called the range of the random variable.
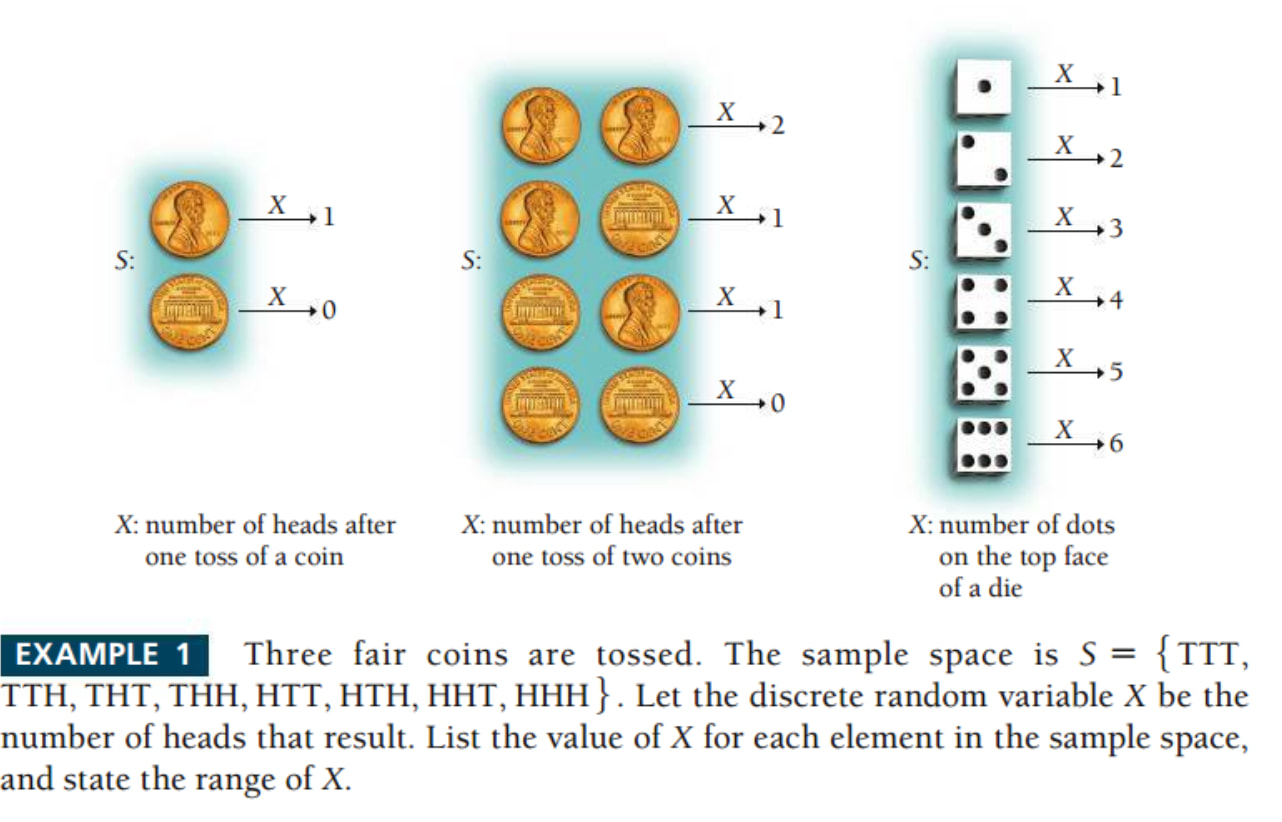
For example, we can define a random variable X to be the number of heads that
result after one toss of a fair coin. We have X=0 (if the coin shows a tail) or X=1 (if
the coin shows a head), and the range of X is {0, 1}. This is illustrated in the following
figure, along with examples of random variables defined for other experiments. Note
that it is possible to define more than one random variable for an experiment.
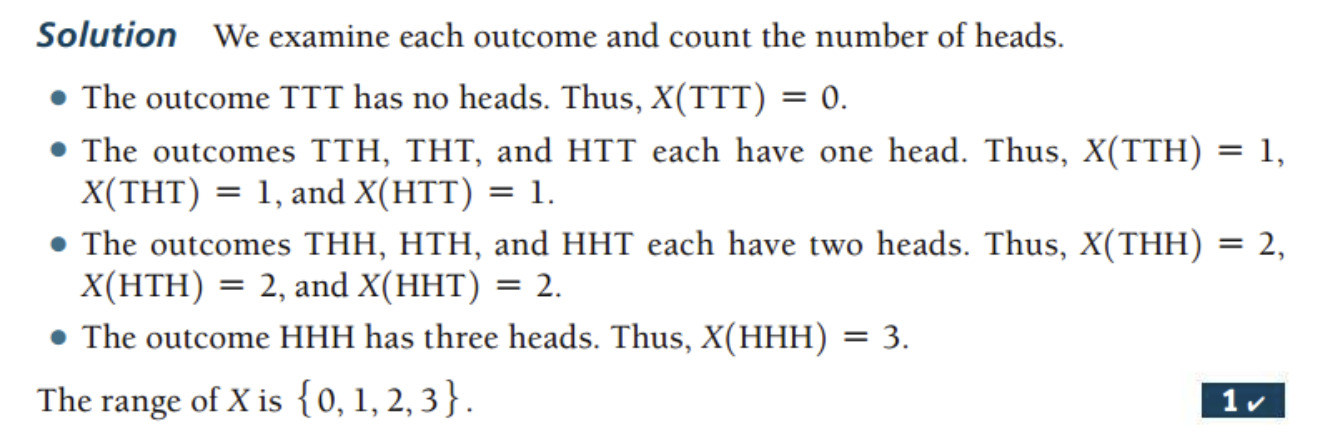
So would it go something like this X(TTT) = 0, X(TTH) = 1, X(THT) = 1, X(THH) = 2, X(HTT) = 1, X(HTH) = 2, X(HHT) = 2, X(HHH) = 3, listing the value of X: 0, 1, 1, 2, 1, 2, 2, 3. The range of X is {0,1,2,3}.
Neat.
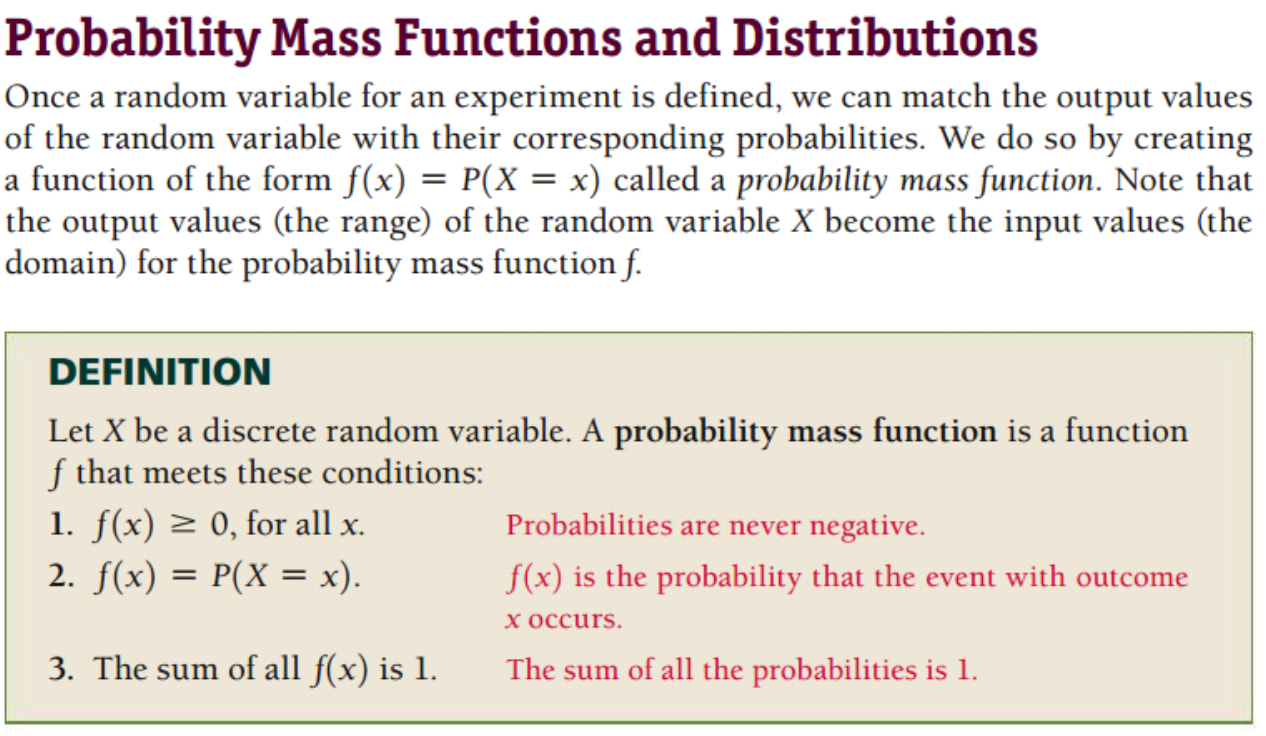
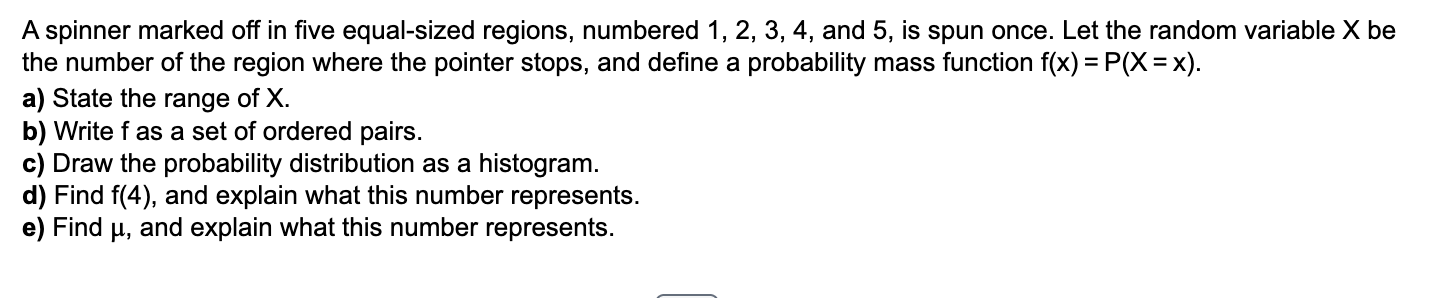
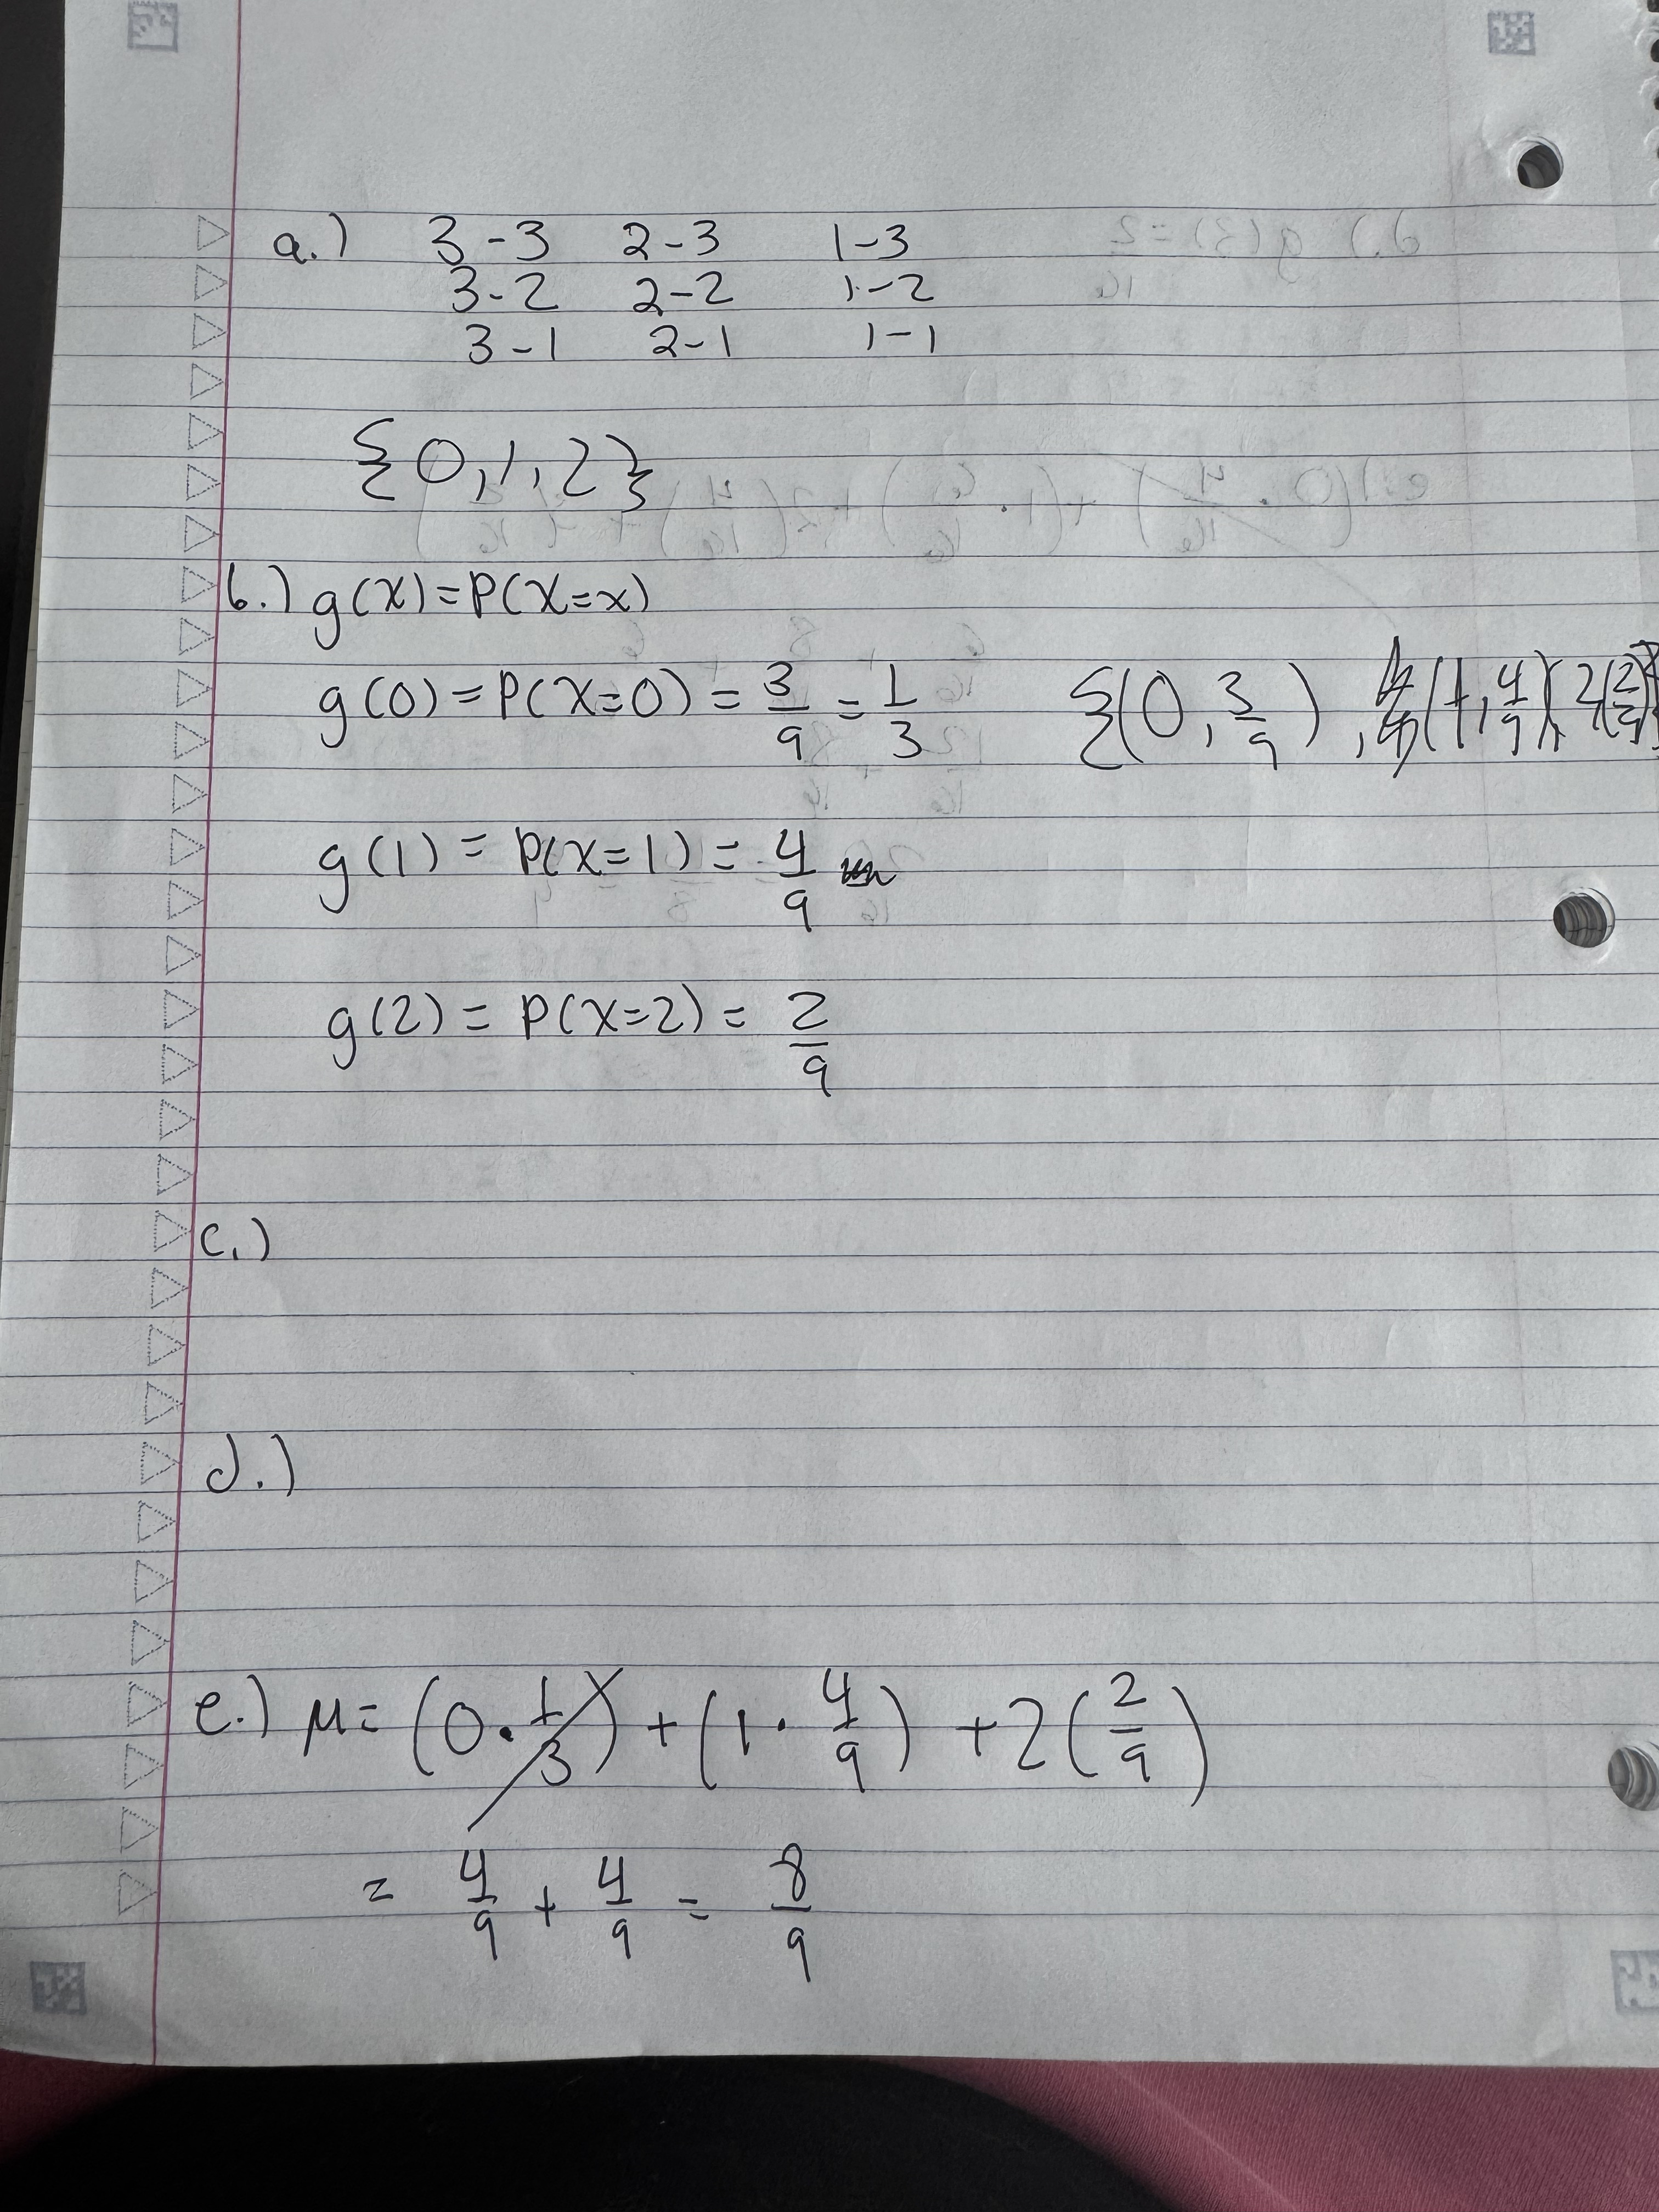
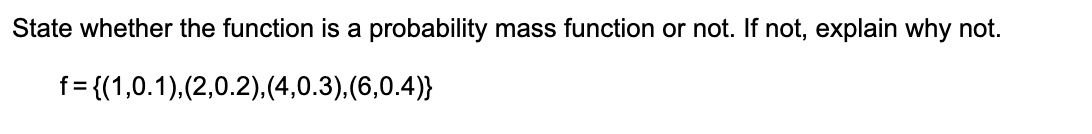
f(x) = P(X=x) ← Probability mass function,
1.) You can’t have a negative chance. You can’t get below no chance of something happening. It either can’t happen or has some chance of happening.
2.) so f(x) outputs the probability that an event occurs
3.) ok
so the probability that an event occurs f(x) is equal to P(X=x). We will be plugging in the the range of the random variable X. So what’s P doing here. Is it representing probability? I’m a little confused.
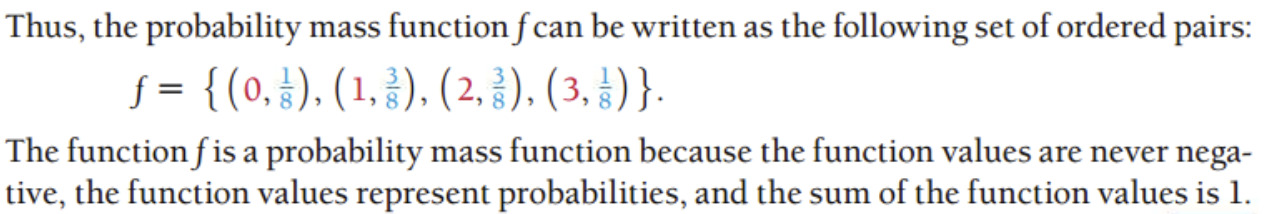
A probability mass function is often written as a set of ordered pairs.
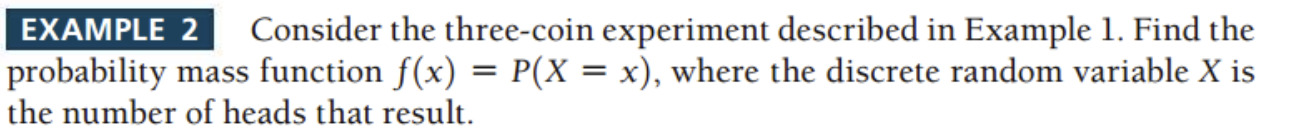
So X is the number is the number of heads that result. X had a range of values from {0, 1, 2, 3}. The list of values X: 0, 1, 1, 2, 1, 2, 2, 3. What do I with this.
Since the sample space deals with fair outcomes each outcome has an equal change of happening. There are 8 different outcomes.

So the input, x, was a type of outcome in this case the numbers of heads being 0. so f(0) represents that. P(X=0) represents what exactly. The probability of when the random variable X = 0? Let’s see with further problems.
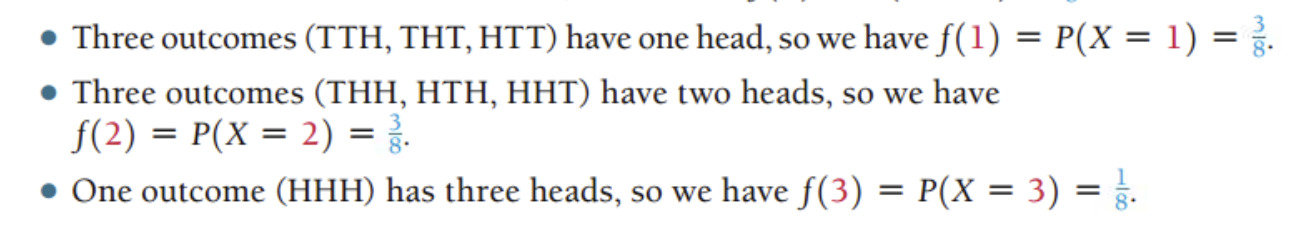
f(1) = P(X=1) = 3/8, this is because out of the 8 possible outcomes three out of eight had 1 head. Ok. So it looks like P represents probability. Ok.
Looking at the final value of f. I guess this is part of the discrete nature of it? f doesn’t take in infinitely many values. In this case it just takes in 4 inputs.
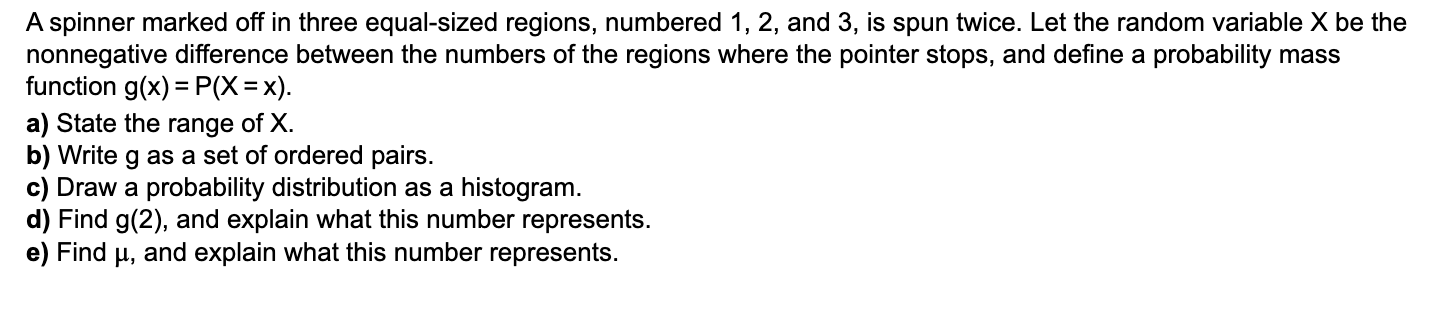
Ok that’s enough for me to do the homework. I’m going to do the homework and share some problems in a separate post.